Last week, I wrote about "Scaling ClickHouse on a Kubernetes Cluster with Sharding and Replication". In that article, I explained scaling Clickhouse pods from 1 to 4.
Building a system is one thing, but maintaining that system is another thing. In order to maintain the system, we should be aware of potential troubles that require constant monitoring of resources and the status of the components that belong to the system.
In this article, I will explain how to set up Prometheus and Grafana and create a monitoring dashboard for your Kubernetes Cluster and its components. Before we dive in, here are the manifest files you need throughout this article: GitHub Repository.
Prometheus
Prometheus collects and stores its metrics as time series data, i.e. metrics information is stored with the timestamp at which it was recorded, alongside optional key-value pairs called labels.
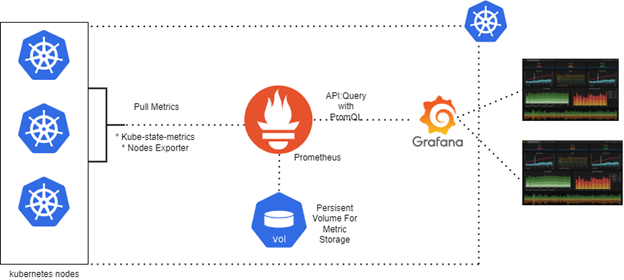
Prometheus collects data from resources such as nodes (machines) or applications via the node exporter and creates alerts based on this data.
For example, Prometheus collects memory usage of your node, and if it is above the threshold, it produces an alert. We should be careful right here, Prometheus is not able to collect data from Kubernetes objects directly, but we are going to use several technologies that enable extracting data from the Kubernetes objects, such as kube-state-metrics.
kube-state-metrics creates metrics for the Kubernetes objects, like pods, deployments, and services, by connecting to the Kubernetes API, and it extracts these metrics in Prometheus format.
kube-state-metrics alone is not sufficient to provide complete visibility. It cannot access the CPU or Memory usage of the pods. So, we also use cAdvisor to obtain metrics of resource usage. But don't worry, Kubelet has integrated cAdvisor with itself, so we don't have to set cAdvisor up too.
Grafana
Grafana is an open-source data visualization tool that can visualize the time metrics data, which we are familiar with from Prometheus. So we use Prometheus to exploit data and Grafana to visualize. This stack with these two technologies helps us to monitor our system, a.k.a. our Kubernetes Cluster, and applications running in it.
Setup Steps
As I mentioned before, you can access the manifest files on that repository: https://github.com/ahmethedev/grafana-prometheus
1. Create a namespace for our monitoring objects
kubectl apply -f monitoring-namespace.yaml
2. RBAC (Role Based Access Control)
kubectl apply -f prometheus-rbac.yaml
3. Prometheus config and deployment
kubectl apply -f prometheus-config.yaml kubectl apply -f prometheus-deployment.yaml
4. Node Exporter
kubectl apply -f node-exporter.yaml
5. Kube-state-metrics
kubectl apply -f kube-state-metrics.yaml
6. Grafana
kubectl apply -f grafana-deployment.yaml
Check the status of the pods
kubectl get pods -n monitoring
If all of the pods are running and ready, test the connection:
- Prometheus:
http://<node-ip>:30090 - Grafana:
http://<node-ip>:30030(admin/admin123)
Note: We are not going to use the Prometheus interface directly. It does its job on the server-side. But we are going to use the Grafana interface a lot.
Set up Grafana Dashboard
After logging in to the Grafana interface:
- Configuration > Data Sources > Add Prometheus
- URL:
http://<node-ip>:30090
Now, we are ready to create dashboards. You can either use templates or create your own empty panels from scratch.
Conclusion
Thanks for reading that far. With this setup, you now have a complete monitoring solution for your Kubernetes cluster that provides visibility into both cluster-level metrics and application performance without relying on Helm charts.